 Risk Posture Tools
The NIST Cybersecurity Framework has become one of the most widely adopted cybersecurity frameworks in the United States, for good reason: it's vendor-neutral, risk-informed, and organized around outcomes rather than specific technical controls. But most organizations that use it stop at the wrong place: they do a CSF assessment, get a maturity score (a practitioner convention layered on the framework, not a native CSF output; see below), and use it to prioritize remediation. That's valuable. It's also only half the picture.
The other half is tracking. A single assessment tells you where you are. Tracking maturity across assessments tells you whether your program is actually moving, in which direction, and at what rate. Without that trend, security investments are unjustifiable to leadership, executive reporting is anecdotal, and regression goes undetected until it becomes a finding.
Where the Maturity Score Comes From (In Brief)
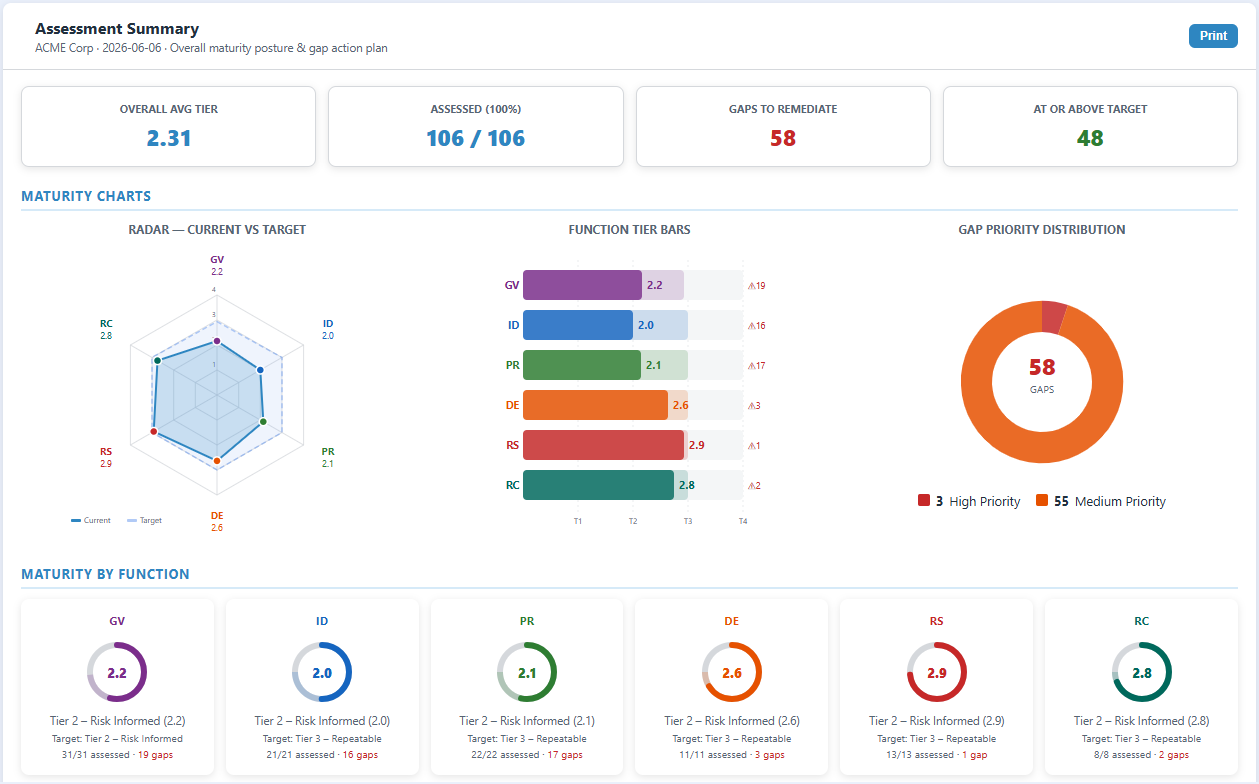
This article assumes you already know how a CSF assessment works. If you don't, start with how to run a free NIST CSF 2.0 self-assessment, which walks through scope, the six functions, and scoring all 106 subcategories. The short recap: NIST CSF 2.0 (released February 2024) organizes cybersecurity outcomes into six functions and 106 subcategories, and to make that measurable, Risk Posture Tools applies a 0–4 maturity score to each subcategory and rolls the scores up to a function-level average. That per-subcategory maturity scale is a practitioner convention layered on top of the CSF, not part of the framework itself: NIST CSF 2.0 does not assign maturity scores to subcategories. See the distinction from CSF Tiers below.
That single set of function-level averages is where most programs stop. It is a snapshot: useful for prioritizing this quarter's remediation, useless for answering whether last quarter's remediation worked. The rest of this article is about the second number you never see in a one-time assessment: the same score, taken again, and again, so the movement between snapshots becomes the thing you actually manage. A snapshot is a position. A sequence of snapshots is a trajectory, and a trajectory is what leadership, auditors, and customers are really asking about.
Why a Single Assessment Has Blind Spots
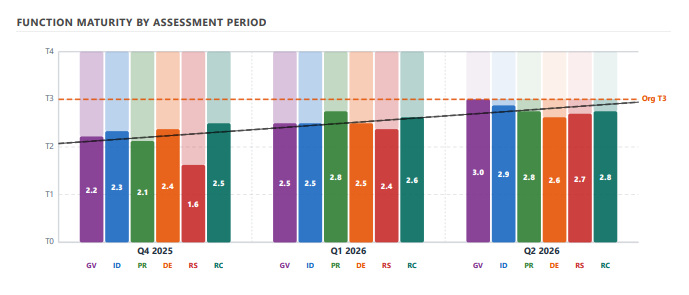
A point-in-time CSF assessment answers: "What is our current maturity?" It doesn't answer: Are we improving or regressing since last quarter? Which investments moved the needle on Respond maturity? Did the new SIEM deployment actually improve our Detect score? Is the gap in Recover closing, or have we been at 1.8 for three assessment cycles?
Without trend data, these questions are answered with assertions. With trend data, they're answered with evidence. That's the difference between a security program and a security posture story you can take to a board, an auditor, or a customer during due diligence.
Trend Tracking Changes How You Prioritize
A common pitfall in CSF gap analysis is chasing the lowest absolute score. If Recover is at 1.8 and everything else is above 2.5, Recover looks like the obvious priority. But if Recover has improved from 1.4 to 1.6 to 1.8 over three cycles and is actively moving, while Respond has been flat at 2.1 for three cycles despite investment, then Respond deserves the scrutiny, not Recover. Trend data reframes the question from "where are we?" to "where are we going, and why?"
What "Maturity" Means Here, and How It Differs From CSF Tiers
First, an important distinction. NIST CSF 2.0 defines four Implementation Tiers (Partial, Risk Informed, Repeatable, and Adaptive) that characterize how cybersecurity risk management is integrated across an organization as a whole. NIST is explicit that the Tiers are not a maturity model, and they are not meant to be applied as a per-subcategory score. They describe organizational rigor, not the implementation level of each individual outcome.
The 0–4 score Risk Posture Tools applies to each subcategory is a separate maturity overlay: a common practitioner approach for making per-outcome progress measurable. It borrows the spirit of the Tier language (ad hoc through adaptive) but is its own scale, not NIST's Tiers. On this scale, 0 means the practice is absent or not yet assessed; 1 means the practice exists but is ad hoc and inconsistent; 3 means it is formally documented, consistently applied, and reviewed; 4 means it adapts continuously using lessons learned. Read function-level averages as a measure of progress over time, not as a NIST Tier rating.
Setting Target Maturity Levels
Target maturity is not an absolute standard; it should reflect your organization's risk profile, mission criticality, and resource constraints. A small business handling limited personal data doesn't need a 4 (continuously adaptive) on every function. A financial institution handling large volumes of sensitive customer data probably should aim higher. Set targets per function rather than chasing a uniform top score.
The CSF 2.0 Assessment tool allows per-function target setting, so you can aim for 3.5 on Govern and Protect (where your risk profile demands formalized practices) and 2.5 on Recover (where your business continuity requirements are less demanding). Gap analysis is then relative to your actual target, not an arbitrary universal benchmark.
CSF Maturity Tracking for Executive Reporting
One of the most valuable uses of maturity trends isn't internal prioritization, it's external communication. Security leaders who can show a board or audit committee that overall CSF maturity moved from 2.1 to 2.8 over 18 months, with documented investment and improvement at each step, are telling a fundamentally different story than those who report a status-quo checklist. During customer due diligence, a trend-supported CSF assessment is far more credible evidence of program health than a one-time self-attestation.
Frequently asked questions
Is a CSF maturity score part of NIST CSF 2.0?
No. NIST CSF 2.0 does not assign maturity scores to subcategories. The 0–4 maturity score that Risk Posture Tools applies to each of the 106 subcategories is a practitioner convention layered on top of the framework to make per-outcome progress measurable, not a native CSF output.
How is CSF maturity different from CSF Implementation Tiers?
NIST CSF 2.0 defines four Implementation Tiers (Partial, Risk Informed, Repeatable, and Adaptive) that characterize how cybersecurity risk management is integrated across an organization as a whole. NIST is explicit that the Tiers are not a maturity model and are not meant to be applied as a per-subcategory score. The 0–4 maturity score is a separate tracking overlay that measures per-outcome progress. A function-level maturity average of 3.0 is not the same as CSF Tier 3.
Why isn't a single CSF assessment enough?
A point-in-time assessment tells you your current maturity but not whether you are improving or regressing, which investments moved the needle, or whether a gap is closing or has been flat for several cycles. Without trend data those questions are answered with assertions rather than evidence, security investments are hard to justify to leadership, executive reporting is anecdotal, and regression goes undetected until it becomes a finding.
How should I set target maturity levels?
Target maturity is not an absolute standard. It should reflect your organization's risk profile, mission criticality, and resource constraints. Set targets per function rather than chasing a uniform top score, for example aiming for 3.5 on Govern and Protect where your risk profile demands formalized practices and 2.5 on Recover where continuity requirements are less demanding. Gap analysis is then relative to your actual target, not an arbitrary universal benchmark.
Related reading
- How to Run a Free NIST CSF 2.0 Self-Assessment
- NIST AI RMF Explained: A Practical Guide to the AI Risk Management Framework
- RMF Simplified: How the Seven Steps Bring Clarity to System Authorization
- the free NIST CSF 2.0 assessment tool
References
- NIST Cybersecurity Framework 2.0 (2024). doi.org/10.6028/NIST.CSWP.29
- NIST CSF 2.0 Reference Tool, all 106 subcategories, informative references, and implementation examples. csrc.nist.gov
- NIST IR 8374, Ransomware Risk Management: A Cybersecurity Framework Profile (2022). doi.org/10.6028/NIST.IR.8374
- NIST SP 800-39, Managing Information Security Risk, Section 2.4, Monitoring risk over time (2011). doi.org/10.6028/NIST.SP.800-39