 Risk Posture Tools
You've done the work. You've identified your threat sources, characterized the threat events, scored likelihood and impact, and now you're staring at two outputs: a heat map with your risks clustered in the "High" zone, and a calculated risk level that seems to tell a milder story. One says you're in trouble. The other looks almost manageable. What happened?
This confusion is common enough that it deserves a clear explanation. The short answer: the qualitative heat map and the semi-quantitative score are computing different things from different inputs, and both can be correct, just about different questions.
What the Heat Map Is Actually Showing
The NIST SP 800-30 risk heat map plots Overall Likelihood on one axis and Overall Impact on the other, producing a color-coded risk level at each intersection. NIST sets out how overall likelihood and impact combine into a risk level in Appendix I (Table I-3), with the risk-level definitions in Table I-2.
The heat map is a policy instrument. Its purpose is to translate raw likelihood/impact combinations into an organizationally meaningful risk posture, one that a decision-maker can act on without reading a methodology document. The upper-right corner (Very High Likelihood + Very High Impact) is always the deepest red. That's a design choice, not a derivation.
Notice what that lookup does not include: the number of distinct threat events you've identified, the effectiveness of controls already in place, the frequency distribution of your specific threat sources, or any per-dimension weighting of Confidentiality, Integrity, and Availability. It maps two values to one cell, not an integral over your entire threat landscape.
What the Calculated Risk Score Is Showing
When Risk Posture Tools computes a risk level, it follows the full SP 800-30 methodology through Appendices G, H, and I, not just the final lookup. For each risk entry, the tool works through:
- Threat source characterization, adversarial sources are rated by capability and intent; non-adversarial sources by likelihood of initiation or occurrence (Tables D-2 through E-4).
- Vulnerability and susceptibility rating, the degree to which the system is susceptible to the threat event given its current configuration and controls (Table G-5).
- Overall likelihood, combining initiation likelihood with susceptibility to produce a single overall likelihood rating (Table G-3/G-5 composite).
- CIA-decomposed impact, Confidentiality, Integrity, and Availability are categorized separately as Low, Moderate, or High (FIPS 199), and the highest of the three sets the system's overall impact; SP 800-30 Appendix H then rates the adverse impact of each threat event on its own Very Low to Very High scale.
- Risk determination, overall likelihood and overall impact are combined per Table I-3 into a risk level (defined in Table I-2); the underlying numeric scoring follows SP 800-30's semi-quantitative assessment scales.
After controls are documented, the tool re-evaluates likelihood with controls factored in, producing a control-adjusted residual risk that reflects actual posture, not just the raw threat environment.
How RPT's Semi-Quantitative Heat Map Works
This is where Risk Posture Tools diverges from a basic heat map generator, and the distinction matters for practitioners who need their outputs to hold up to scrutiny.
The tool assigns numeric values to qualitative ratings drawing on the SP 800-30 Appendix I semi-quantitative approach. NIST's semi-quantitative assessment scales express each qualitative level as a band on a numeric range (NIST presents these on both a 0–10 and a 0–100 normalized scale), which lets risks be ordered and compared across a register rather than collapsed into a few buckets. Risk Posture Tools maps ratings to representative values within that scheme so individual risks can be prioritized. What the standard prescribes is the ordinal comparison, not one specific set of numbers, so treat any single value (a 2 / 4 / 6 / 8 / 10 style mapping, for instance) as one representation rather than a NIST mandate.
Rather than placing risks into 25 qualitative buckets and calling it done, RPT computes a numeric risk score for each entry using the composite of its intermediate inputs. That score is then mapped back to the Table I-2 risk levels (Very Low, Low, Moderate, High, Very High) for the heat map display. The result: the heat map cell reflects the full upstream methodology, not just two numbers dropped into a lookup grid.
Both the heat map cell and the numeric score in RPT are computed from the same underlying values, so they never reflect conflicting inputs. Where the qualitative cell and the score still point at different bands (a Moderate cell over a Low score, say), that gap is the coarseness of the 5×5 grid, not a data conflict, and it is exactly the divergence the rest of this article unpacks.
The Residual Risk View: After Controls
The heat map has a second mode: residual risk. Once you've documented controls for each risk entry and rated their implementation level and effectiveness, the tool re-computes each risk's position using control-adjusted likelihood. The same heat map now shows where your risks land after your security investment is accounted for.
Comparing the inherent and residual views is what makes the heat map useful for an authorizing official: the inherent view shows the threat landscape, the residual view shows what your controls actually bought you, and the distance between them is the visible return on your security investment.
The Three Reasons Heat Map and Score Still Diverge in Other Tools
If you've used other tools or spreadsheet-based assessments, you may have seen the heat map and the summary score produce different messages. RPT doesn't make the divergence disappear; it shows both readings, computes them from the same numbers, and explains the gap. Here's what causes it:
1. Comparing inherent risk to residual risk
The heat map often displays inherent risk (pre-control). The summary score, if controls have been documented, may be showing residual risk. These should be different, a High inherent risk with strong controls should produce a Moderate residual. If a tool doesn't make the inherent/residual distinction explicit, the two outputs will look misaligned even when both are correct.
In RPT, both views are labeled clearly and toggled independently. The register shows both inherent and residual levels side by side for each entry, so you always know which view you're comparing to which.
2. The qualitative scale is coarser than the underlying score
The 5×5 grid maps 25 possible likelihood/impact combinations to five risk levels. Multiple distinct combinations collapse into the same colored cell, a risk that's "barely High likelihood" and one that's "solidly High likelihood" land in the same box. The semi-quantitative score beneath captures the gradient; the cell color doesn't.
RPT preserves the numeric score alongside the cell label, so practitioners can distinguish between, say, two "High" risks where one scores 84 and the other 91 on the 0–100 scale. That distinction matters when prioritizing remediation sequencing.
This is also where a continuous heat map earns its keep. A discrete 5×5 grid can only drop a risk into one of 25 boxes. RPT also renders the semi-quantitative result as a smooth gradient surface, where Very Low through Very High are bands on a continuous field rather than hard-edged cells. A risk's exact computed likelihood and impact place it precisely on that surface, so you can see not just which band it falls in, but whether it sits deep inside the band or right on the boundary with the next one.
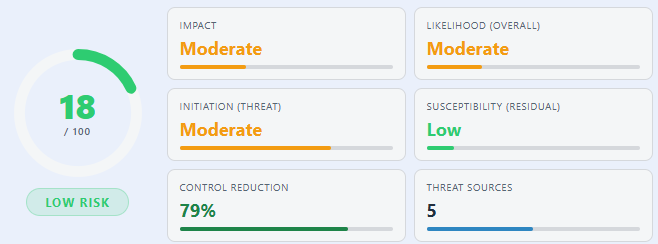
Consider one risk after controls. Its calculated residual score comes out to 18 / 100, a Low result, with Moderate overall likelihood and Moderate overall impact:
Here is where that same point lands on each heat map:
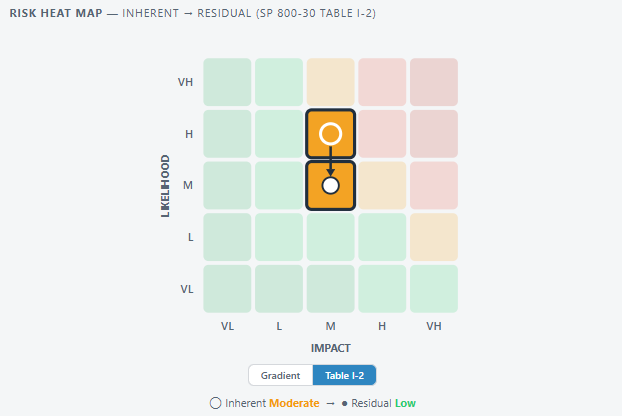
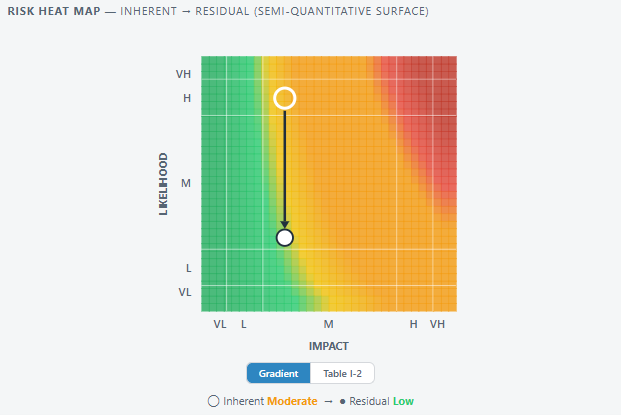
Both readings are legitimate NIST methods. SP 800-30 (Section 2.4) supports qualitative, semi-quantitative, and quantitative assessment, each trading precision for simplicity. The discrete Table I-3 cell is the qualitative reading: a Moderate likelihood crossed with a Moderate impact rounds to a Moderate cell. The semi-quantitative composite for the same risk works out to 18 on the 0–100 scale, which sits in the Low band (5–20). The cell is not wrong, just coarse: with only 25 boxes, a result low within the Moderate likelihood range bins to the same Moderate cell as one high within it.
The gradient surface is that semi-quantitative result drawn as a continuous field, so the same point lands where the number puts it: inside the Low (green) band, close to the boundary with Moderate. It carries more information than the cell or the score alone. It tells you the risk is Low today, but not by a wide margin, so a small erosion of controls could push it back over the line. That position within the band is invisible on a 5×5 grid, and surfacing it is what the semi-quantitative view is for. The score and the qualitative cell are answering the same question at different resolutions, not contradicting each other.
3. CIA impact isn't decomposed before the matrix lookup
FIPS 199 has you rate Confidentiality, Integrity, and Availability separately, then carry the highest of the three as the overall impact: the high-water mark. Each objective carries its own FIPS 199 categorization of Low, Moderate, or High, and that overall categorization then informs the threat-event impact rating the matrix consumes (see below). If you set overall impact to Moderate up front, but Confidentiality is actually High while Integrity and Availability are Low, the correct overall impact is High, not Moderate. Collapsing CIA into one rating before that impact rating is derived understates risk for systems with an asymmetric CIA profile.
RPT scores C, I, and A individually on the Low / Moderate / High scale and derives the overall categorization from the high-water mark, exactly as FIPS 199 specifies. That categorization then informs the threat-event impact rating on SP 800-30's Very Low to Very High scale, which is the value the risk matrix actually consumes. The two scales do different jobs: FIPS 199 categorizes the system, SP 800-30 rates the harm of a specific threat event.
What NIST Actually Intends
NIST SP 800-30 Rev 1, Section 2.4 explicitly acknowledges that risk assessments can be qualitative, semi-quantitative, or quantitative, and that each approach involves tradeoffs. The heat map is best suited for communicating risk to decision-makers. The semi-quantitative score is designed for analysts who need to produce and defend those ratings.
Both outputs belong in the same assessment. The heat map gives your CISO a visual for the quarterly board deck. The numeric score gives your assessor the documented rationale for a finding's severity level. They aren't in competition, and in a properly structured assessment, they can't contradict each other.
Using the Risk Assessment Tool
The Risk Posture Tools Risk Assessment implements the full SP 800-30 workflow, threat source characterization, threat event identification, intermediate likelihood steps, CIA-decomposed impact scoring, semi-quantitative risk scoring, and control-adjusted residual risk, and displays both the heat map and the score register from the same computed data. Toggling between inherent and residual views shows the before/after effect of your documented controls.
The methodology tables cited in each step (G-2, G-3, G-5, H-2, I-2, I-3) are available in-tool, so every rating decision has a documented NIST reference. When an AO asks how you arrived at a Very High, you have both the methodology citation and the specific inputs that produced it.
Frequently asked questions
Why does my SP 800-30 heat map show a different risk level than my calculated risk score?
The qualitative heat map and the semi-quantitative score are computing different things at different resolutions, and both can be correct. The heat map maps your overall likelihood and overall impact to one of 25 colored cells, while the semi-quantitative score captures the gradient beneath those two values. Where a qualitative cell and the score point at different bands, that gap is the coarseness of the 5×5 grid, not a data conflict. In a properly structured assessment where both are computed from the same underlying values, they never reflect conflicting inputs.
What is the SP 800-30 heat map actually showing?
The NIST SP 800-30 risk heat map plots Overall Likelihood on one axis and Overall Impact on the other, producing a color-coded risk level at each intersection. NIST sets out how overall likelihood and impact combine into a risk level in Appendix I (Table I-3), with the risk-level definitions in Table I-2. It maps two values to one cell. It does not include the number of distinct threat events, the effectiveness of controls already in place, the frequency distribution of your threat sources, or any per-dimension weighting of Confidentiality, Integrity, and Availability.
Why does a Moderate heat map cell sometimes sit over a Low semi-quantitative score?
The 5×5 grid maps 25 possible likelihood/impact combinations to five risk levels, so multiple distinct combinations collapse into the same colored cell. A Moderate likelihood crossed with a Moderate impact rounds to a Moderate cell, but the semi-quantitative composite for the same risk can work out to a value in the Low band (for example, 18 on the 0–100 scale, where Low is 5–20). The cell is not wrong, just coarse: a result low within the Moderate likelihood range bins to the same cell as one high within it. Both readings are legitimate NIST methods answering the same question at different resolutions.
Why does decomposing CIA impact before the matrix lookup matter?
FIPS 199 has you rate Confidentiality, Integrity, and Availability separately, then carry the highest of the three as the overall impact, the high-water mark. If you set overall impact to Moderate up front but Confidentiality is actually High while Integrity and Availability are Low, the correct overall impact is High, not Moderate. Collapsing CIA into one rating before the impact rating is derived understates risk for systems with an asymmetric CIA profile. RPT scores C, I, and A individually and derives the overall categorization from the high-water mark, which then informs the threat-event impact rating on SP 800-30's Very Low to Very High scale that the matrix consumes.
Related reading
- NIST SP 800-30 Risk Assessment: A Template and Worked Example
- What Is Risk? The NIST Definition and Why It Changes How You Assess
- The POA&M: Why Tracking Remediation Is What Keeps Your ATO Alive
- the free risk register tool
References
- NIST SP 800-30 Rev 1, Guide for Conducting Risk Assessments (2012). Tables G-2, G-3, G-5, H-2, I-2, I-3. doi.org/10.6028/NIST.SP.800-30r1
- NIST SP 800-39, Managing Information Security Risk (2011). Section 2.2, Risk Framing. doi.org/10.6028/NIST.SP.800-39
- FIPS 199, Standards for Security Categorization of Federal Information and Information Systems (2004). doi.org/10.6028/NIST.FIPS.199